
Photos
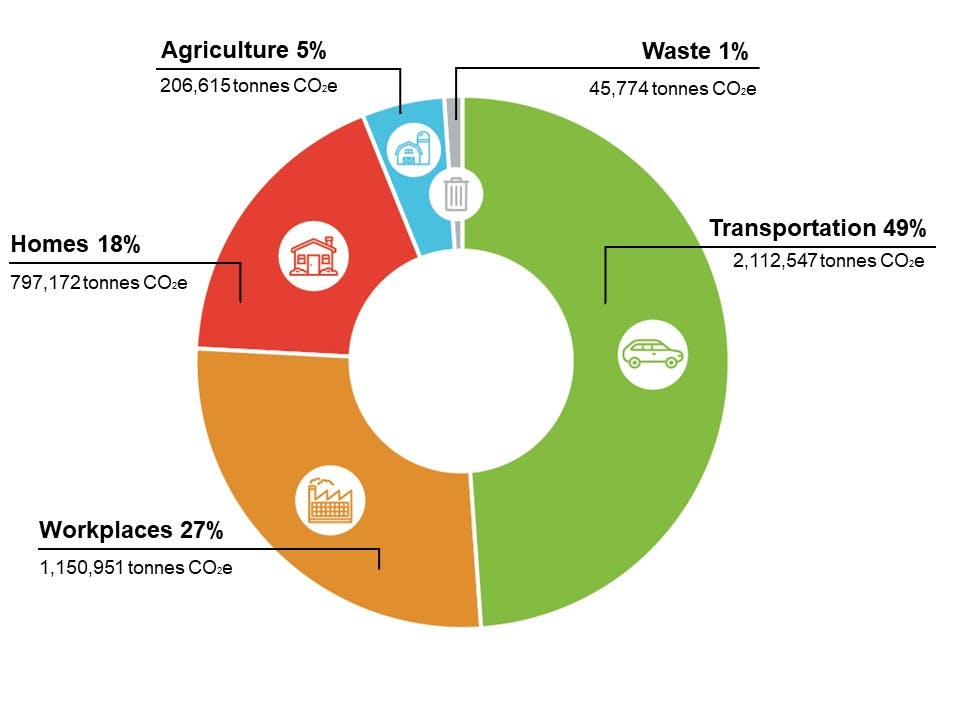
Waterloo Region 2015 community greenhouse gas emissions by sector
A pie chart showing local 2015 greenhouse gas emissions. The transportation sector is 49%, the workplaces sector is 27%, the homes sector is 18%, the agriculture sector is 5%, and the waste sector is 1%.